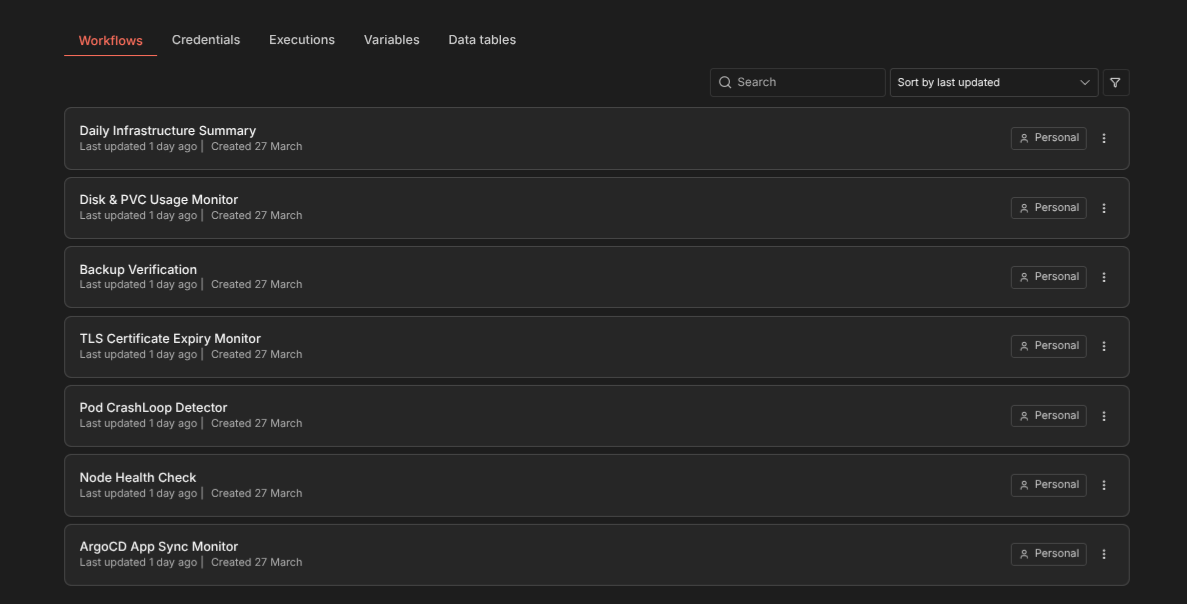
Automating Infrastructure Health Checks with n8n
Seven n8n workflows that monitor ArgoCD sync state, node health, pod CrashLoops, TLS certificate expiry, backup verification, disk usage, and send a daily infrastructure summary — all alerting via Signal.
Why Automate Beyond Prometheus
Prometheus and Uptime Kuma are reactive — they show you data and alert on thresholds. But some checks don’t fit neatly into a metrics-based model. Is a backup CronJob actually producing valid snapshots? Has an ArgoCD app been out of sync for 2 hours? Is a TLS certificate about to expire that cert-manager forgot to renew?
I built 7 n8n workflows that run on a schedule, SSH into the K3s master to execute kubectl commands, parse the results, and send alerts through a self-hosted Signal API. No external dependencies, no SaaS alerting services.
The Setup
n8n runs on the K3s cluster itself, deployed with a custom Helm chart and PostgreSQL subchart. It connects to the master node via an SSH credential configured in n8n’s UI.
Alerts go through signal-cli-rest-api, a self-hosted Signal gateway running in the monitoring namespace. The workflow sends HTTP POST requests to the Signal API, which delivers messages to my phone.
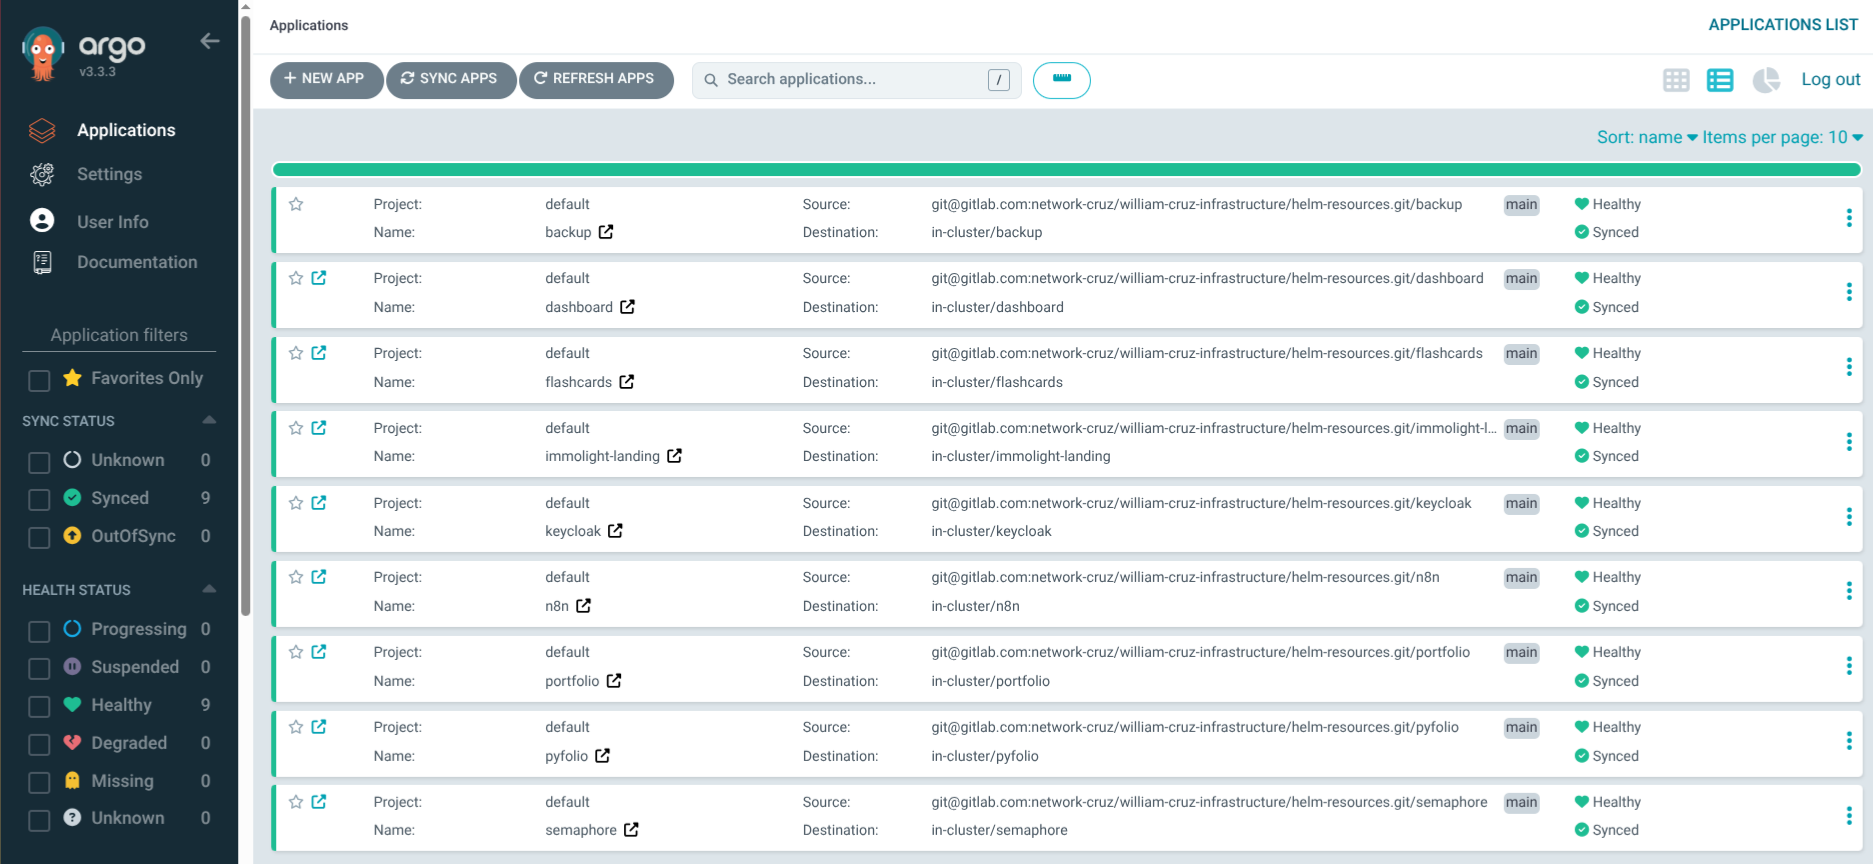
Workflow 1: ArgoCD App Sync Monitor
Schedule: Every 15 minutes
ArgoCD manages 9 applications. This workflow runs kubectl get applications -n argocd -o json, parses each app’s sync and health status, and alerts if anything is OutOfSync or Degraded.
If it finds a problem, it takes action: patches the ArgoCD Application to force an immediate re-sync, waits 2 minutes, then re-checks. If the app recovers, it sends a recovery notification. If it’s still broken, it escalates to a critical alert.
# The self-healing action
kubectl -n argocd patch application <app-name> --type merge \
  -p '{"operation":{"initiatedBy":{"username":"n8n-automation"},"sync":{"prune":true}}}'
This is safe because all apps already have selfHeal: true — the workflow just forces an immediate retry instead of waiting for ArgoCD’s next poll cycle.
Workflow 2: Node Health Check
Schedule: Every 10 minutes
Runs kubectl get nodes -o json and checks that all 3 nodes report Ready. Alerts on NotReady, MemoryPressure, DiskPressure, or PIDPressure conditions.
A node going NotReady on a 3-node cluster means losing a third of compute capacity. This workflow catches it faster than waiting for pods to fail and Uptime Kuma to detect endpoint outages.
Workflow 3: Pod CrashLoop Detector
Schedule: Every 10 minutes
Scans all namespaces for pods with restartCount > 5 or in CrashLoopBackOff state. Includes the pod name, namespace, restart count, and last termination reason in the alert.
A pod in CrashLoopBackOff is Kubernetes trying to restart a failing container with exponential backoff. By the time the backoff reaches 5 minutes, the service has been degraded for a while. This workflow catches it early.
Workflow 4: TLS Certificate Expiry Monitor
Schedule: Daily at 8:00 AM
Runs kubectl get certificates -A -o json and checks each certificate’s notAfter date. Alerts if any certificate expires within 14 days.
cert-manager handles automatic renewal, but sometimes things go wrong — the ACME challenge fails, the ClusterIssuer has an issue, or a certificate gets stuck in a False ready state. This workflow is the safety net.
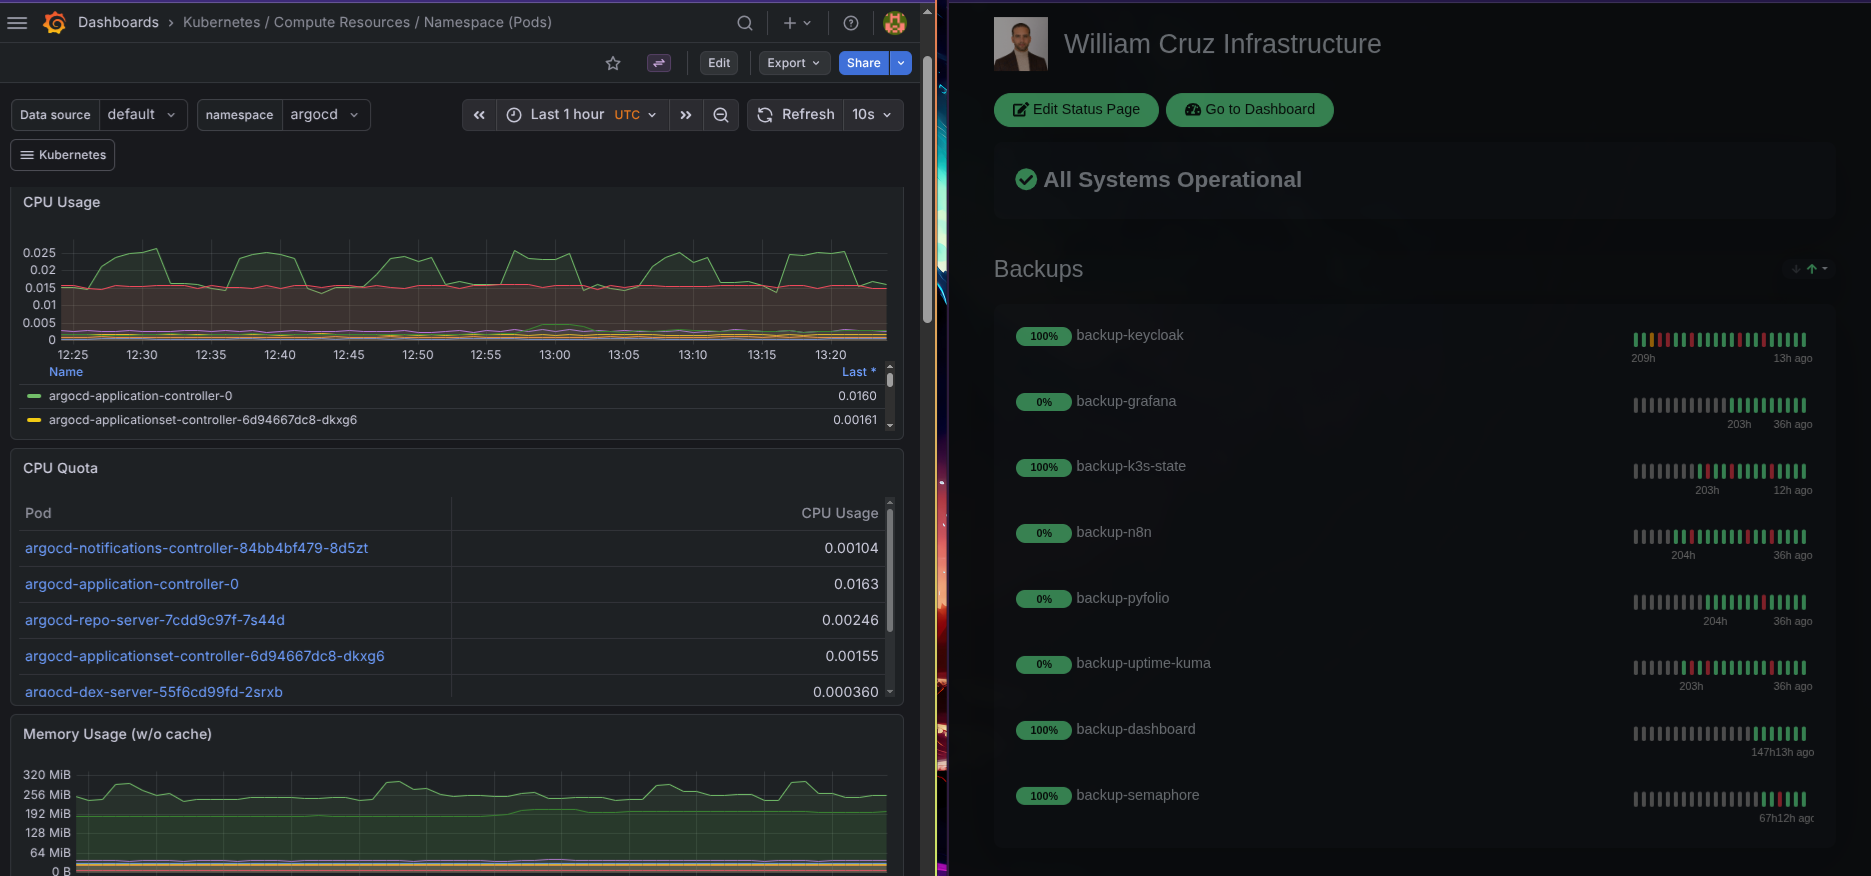
Workflow 5: Backup Verification
Schedule: Daily at 10:00 AM (after backups run at 2-3 AM)
Checks that every backup CronJob ran successfully in the last 24 hours. Looks at kubectl get jobs for each namespace and verifies at least one completed successfully.
The backup system uses Uptime Kuma push monitors as heartbeats, but this workflow provides a second verification layer — it checks the actual Kubernetes Job status rather than relying on the heartbeat reaching Uptime Kuma.
Workflow 6: Disk & PVC Usage Monitor
Schedule: Every 30 minutes
SSHs into the master and runs df -h on each node (master directly, workers via kubectl exec on DaemonSet pods). Also checks PVC usage via kubectl exec into application pods. Alerts when disk usage exceeds 80%.
The local-path provisioner stores PVC data on node disks. If a node’s disk fills up, every PVC on that node stops working — databases crash, backups fail, pods get evicted. This workflow prevents that scenario.
Workflow 7: Daily Infrastructure Summary
Schedule: Daily at 9:00 AM
This is the “all clear” workflow. It collects health data from all six areas (nodes, apps, certificates, backups, disk, PVCs) and sends a single summary message:
📊 Daily Infrastructure Summary

Nodes: 3/3 Ready ✅
Apps: 9/9 Synced + Healthy ✅
Certs: 12/12 Valid (nearest expiry: 67 days) ✅
Backups: 8/8 ran in last 24h ✅
Disk: master 45% | worker-1 38% | worker-2 41% ✅

No issues detected.
Silence from the alert workflows could mean “everything is fine” or “the monitoring itself is broken.” The daily summary eliminates that ambiguity — if I don’t get it at 9 AM, something is wrong with n8n itself.
Signal Over Email or Slack
I chose Signal for alerts because:
- Self-hosted relay: The
signal-cli-rest-apicontainer runs in my cluster — no third-party service - Instant delivery: Push notifications hit my phone immediately
- No noise: Signal isn’t cluttered with work messages like Slack or email
- End-to-end encrypted: Alert messages with service names and status stay private
The Signal API is simple — an HTTP POST with the recipient number and message text. n8n’s HTTP Request node handles it natively.
The Cost of Not Automating
Before these workflows, I found out about issues when users complained or when I happened to check the ArgoCD UI. Once, a backup CronJob failed silently for 22 hours because the Uptime Kuma heartbeat wget returned a 404 (a SQLite bug in Uptime Kuma), making the container exit non-zero. Kubernetes retried 6 times, each time re-running the full backup unnecessarily.
That incident led to two changes: the n8n backup verification workflow, and making heartbeat pushes non-fatal in all backup scripts (|| echo "WARNING: heartbeat push failed").