Monitoring a K3s Cluster: Prometheus, Grafana, and Beyond
Deploying a full observability stack on K3s — kube-prometheus-stack for metrics and dashboards, Uptime Kuma for status pages, Glances for system-level monitoring, and Traefik dashboard for ingress visibility.
Four Layers of Monitoring
Running services without visibility into what’s happening is asking for trouble. I set up four complementary monitoring tools, each covering a different layer:
- Prometheus + Grafana (kube-prometheus-stack) — Cluster metrics, pod resource usage, node health, alerting rules
- Uptime Kuma — External endpoint monitoring with a public status page
- Glances — Real-time system metrics (CPU, RAM, disk, network) per node via REST API
- Traefik Dashboard — Ingress routing visibility, entrypoints, middleware chain
kube-prometheus-stack: One Helm Chart, Full Observability
The kube-prometheus-stack bundles Prometheus, Grafana, Alertmanager, and ~30 pre-built dashboards into a single Helm release. I deploy it with an Ansible playbook that uses kubernetes.core.helm:
- name: Install kube-prometheus-stack
  kubernetes.core.helm:
    kubeconfig: "{{ kubeconfig_path }}"
    name: kube-prometheus-stack
    chart_ref: prometheus-community/kube-prometheus-stack
    chart_version: "82.10.3"
    release_namespace: monitoring
    create_namespace: true
    values:
      grafana:
        adminPassword: "{{ vault_grafana_admin_password }}"
        ingress:
          enabled: true
          hosts:
            - grafana.williamcruz.ch
          annotations:
            cert-manager.io/cluster-issuer: letsencrypt-prod
          tls:
            - secretName: grafana-tls
              hosts:
                - grafana.williamcruz.ch
The Grafana admin password comes from Ansible Vault — never hardcoded in values files. After deployment, Grafana is accessible at grafana.williamcruz.ch with a valid Let’s Encrypt certificate.
What Prometheus Collects
Out of the box, the stack scrapes metrics from:
- kubelet — Pod lifecycle, container resource usage
- kube-state-metrics — Kubernetes object state (deployments, pods, nodes)
- node-exporter — Hardware and OS metrics from every node
- CoreDNS — DNS query rates and errors
- etcd — K3s embedded datastore health
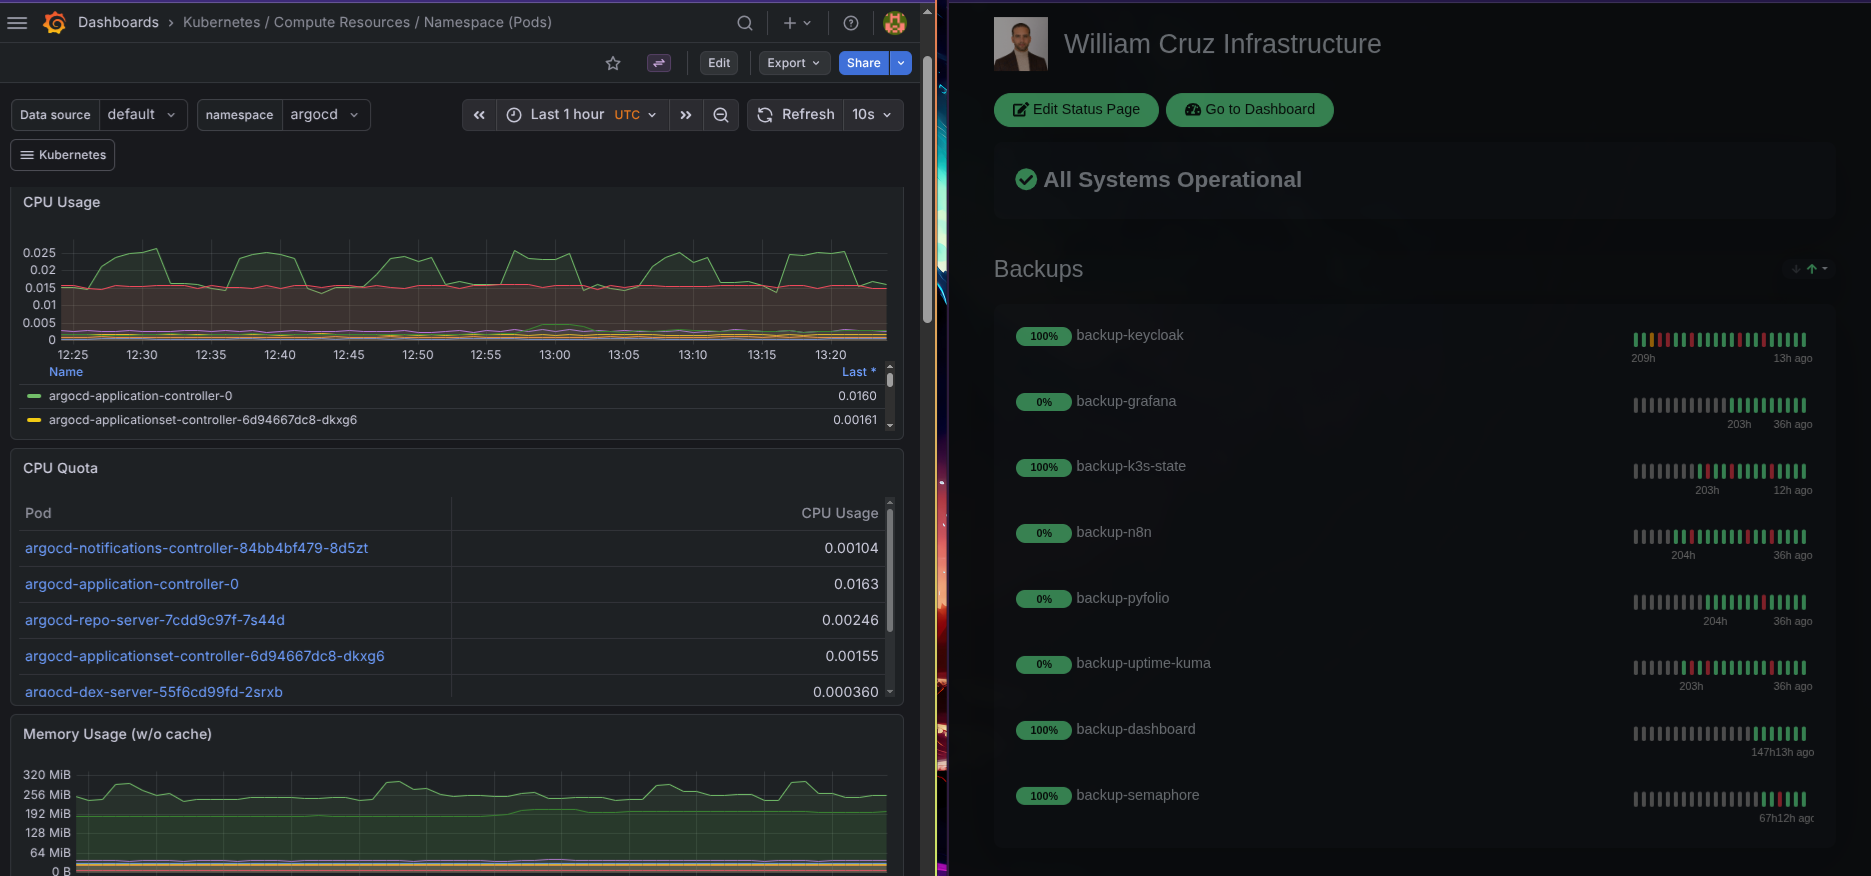
This gives me dashboards for everything: CPU/memory per pod, disk I/O per node, network traffic, Kubernetes API latency, and more.
Uptime Kuma: The Public Status Page
Uptime Kuma monitors all public endpoints with HTTP keyword checks and TLS certificate validation. It runs on the cluster as a Helm deployment in the monitoring namespace.
The public status page at status.williamcruz.ch shows real-time uptime for every service:
- williamcruz.ch (Portfolio)
- dashboard.williamcruz.ch
- grafana.williamcruz.ch
- argocd.williamcruz.ch
- n8n.williamcruz.ch
- auth.williamcruz.ch (Keycloak)
- And every other subdomain
Uptime Kuma also receives push heartbeats from backup CronJobs — if a backup doesn’t check in within its expected window, the monitor turns red. This bridges monitoring with the backup system.
Glances: System-Level Metrics
Prometheus handles Kubernetes-level metrics well, but sometimes I need raw system data — actual disk usage, network interface throughput, running processes. Glances runs as a DaemonSet so every node has an instance, exposed via REST API.
The infrastructure dashboard (a separate Next.js app) polls the Glances API to show real-time CPU, RAM, and disk usage per node.
Traefik Dashboard
Traefik’s built-in dashboard shows all active routers, services, middlewares, and entrypoints. I expose it at traefik.williamcruz.ch with BasicAuth protection via an Ansible playbook:
- name: Deploy Traefik Dashboard with BasicAuth
  kubernetes.core.k8s:
    kubeconfig: "{{ kubeconfig_path }}"
    state: present
    definition:
      apiVersion: traefik.io/v1alpha1
      kind: IngressRoute
      metadata:
        name: traefik-dashboard
        namespace: kube-system
      spec:
        entryPoints: [websecure]
        routes:
          - match: Host(`traefik.williamcruz.ch`)
            kind: Rule
            middlewares:
              - name: traefik-auth
            services:
              - name: api@internal
                kind: TraefikService
How They Work Together
Each tool covers a blind spot the others miss:
- Prometheus tells me a pod is using 90% of its memory limit
- Uptime Kuma tells me the endpoint is returning 502 errors to real users
- Glances tells me the node’s disk is 95% full
- Traefik Dashboard tells me the ingress route is misconfigured
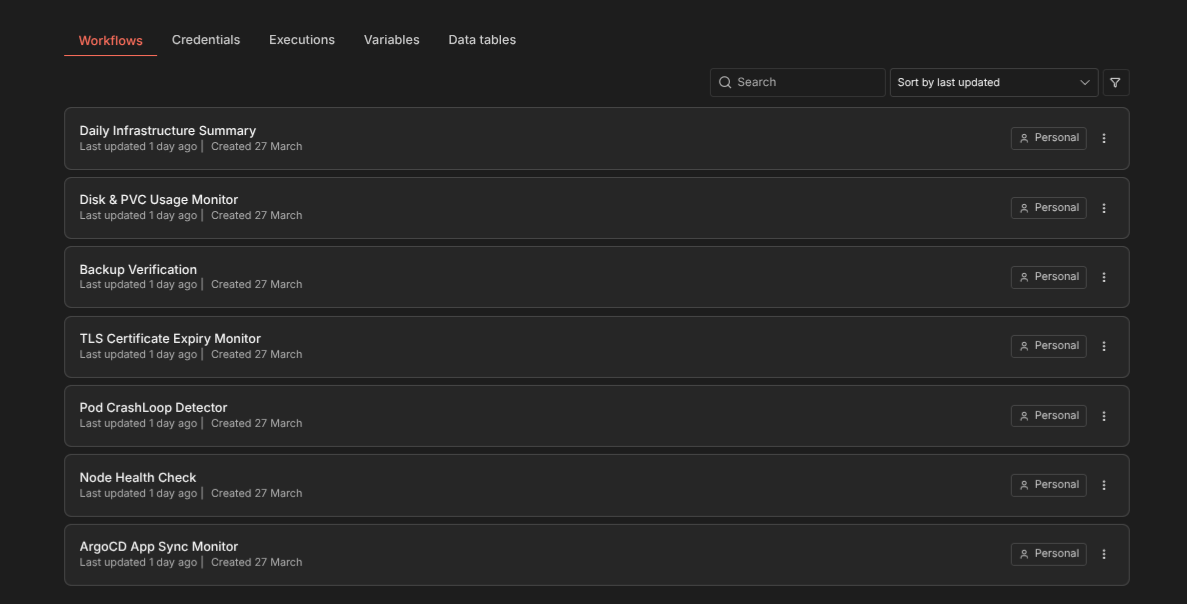
When the n8n automation layer sits on top (covered in a separate article), these tools feed into automated workflows that detect issues and send Signal alerts before I notice anything is wrong.
Deployment Order Matters
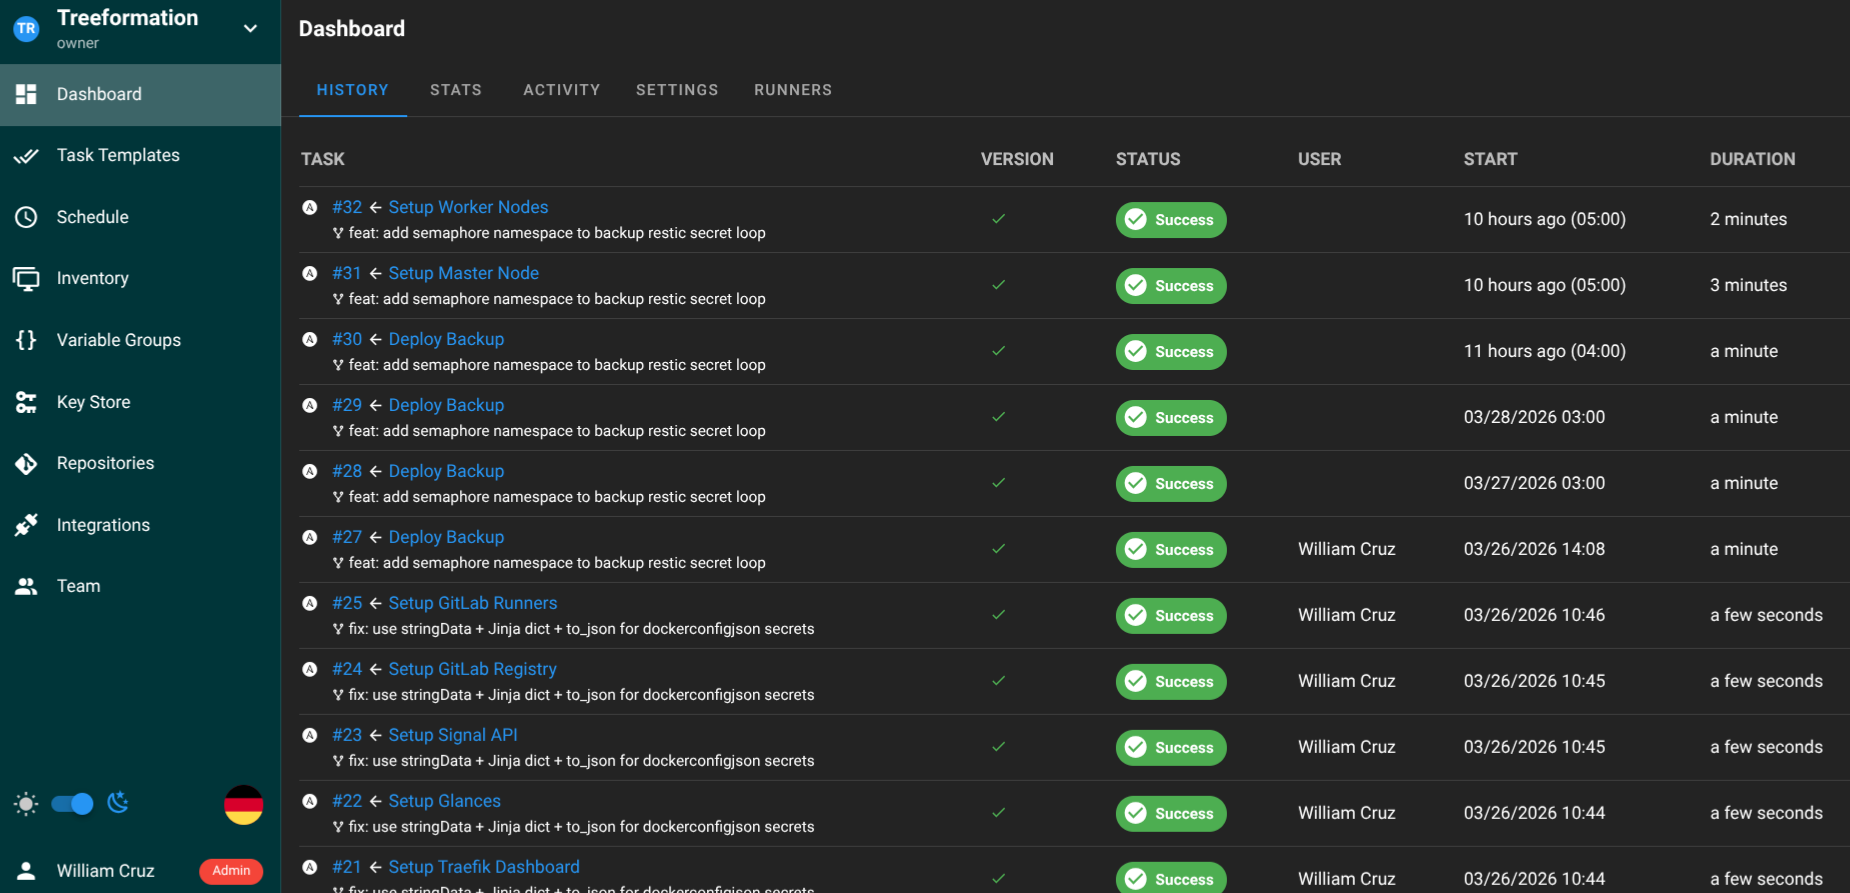
The monitoring stack deploys after K3s and ArgoCD are running but before any application. This way I can observe every subsequent deployment. The Ansible playbook order:
setup_kube_prometheus_stack.yaml— Prometheus + Grafanasetup_uptimekuma.yaml— Uptime Kumasetup_glances.yaml— Glances DaemonSetsetup_traefik_dashboard.yaml— Traefik with BasicAuth
Total deployment time for the full monitoring stack: about 10 minutes.
Resource Cost
On a 3-node cluster with 12 vCPUs total, the monitoring stack consumes roughly:
- Prometheus: ~500 MB RAM, minimal CPU when not scraping
- Grafana: ~200 MB RAM
- Uptime Kuma: ~150 MB RAM
- Glances: ~50 MB RAM per node
It’s noticeable but acceptable. Prometheus is the heaviest component — if resources get tight, adjusting scrape intervals and retention periods is the first lever.